Roof Pitch Chart: Ratio, Percent, and Degrees in Three Reverse-Check Tables
A roof pitch chart is reliable only when you can trace every value back to the same measured rise and horizontal run. Measure first, then use the three tables below to express that one slope as a ratio, percent, and angle—and reverse-check it before you use it.
Start with one matched measurement
Set a level horizontally, choose a run, and measure the vertical rise at that same run. A 2-foot level can be used in the field: mark the 12-inch point on the level, keep the level horizontal, and measure vertically from that mark to the roof surface. The numbers below assume a 12-inch horizontal run so that the familiar x:12 notation remains visible.
Do not mix the vertical rise from one point with the horizontal run from another. The ratio, percent, angle, and sloped-length factor all describe the same right triangle only when they start with the same two measurements.
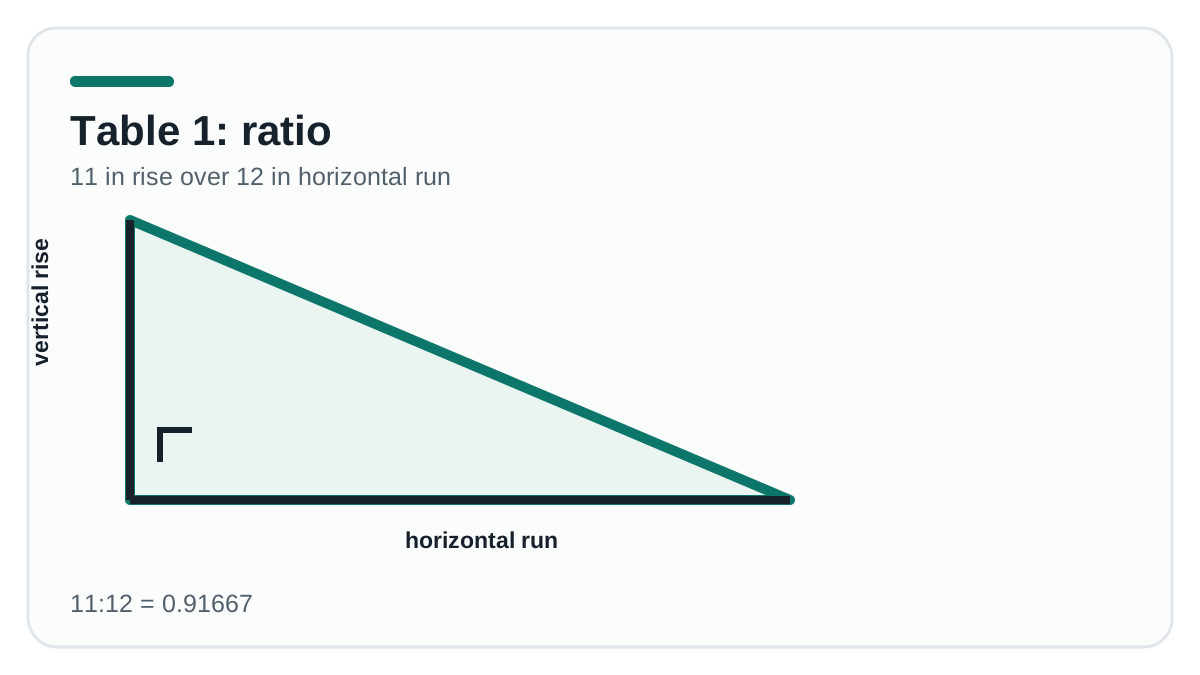
Table 1: rise and run → roof-pitch ratio
Read this table from a measurement to the notation used on drawings. The decimal slope is the reverse-check: divide the printed rise by the printed run.
| Measured rise | Horizontal run | Pitch notation | Rise ÷ run | Reverse check |
|---|---|---|---|---|
| 1 in | 12 in | 1:12 | 0.08333 | 1 ÷ 12 = 0.08333 |
| 2 in | 12 in | 2:12 | 0.16667 | 2 ÷ 12 = 0.16667 |
| 3 in | 12 in | 3:12 | 0.25000 | 3 ÷ 12 = 0.25000 |
| 4 in | 12 in | 4:12 | 0.33333 | 4 ÷ 12 = 0.33333 |
| 5 in | 12 in | 5:12 | 0.41667 | 5 ÷ 12 = 0.41667 |
| 6 in | 12 in | 6:12 | 0.50000 | 6 ÷ 12 = 0.50000 |
| 7 in | 12 in | 7:12 | 0.58333 | 7 ÷ 12 = 0.58333 |
| 8 in | 12 in | 8:12 | 0.66667 | 8 ÷ 12 = 0.66667 |
| 9 in | 12 in | 9:12 | 0.75000 | 9 ÷ 12 = 0.75000 |
| 10 in | 12 in | 10:12 | 0.83333 | 10 ÷ 12 = 0.83333 |
| 11 in | 12 in | 11:12 | 0.91667 | 11 ÷ 12 = 0.91667 |
| 12 in | 12 in | 12:12 | 1.00000 | 12 ÷ 12 = 1.00000 |
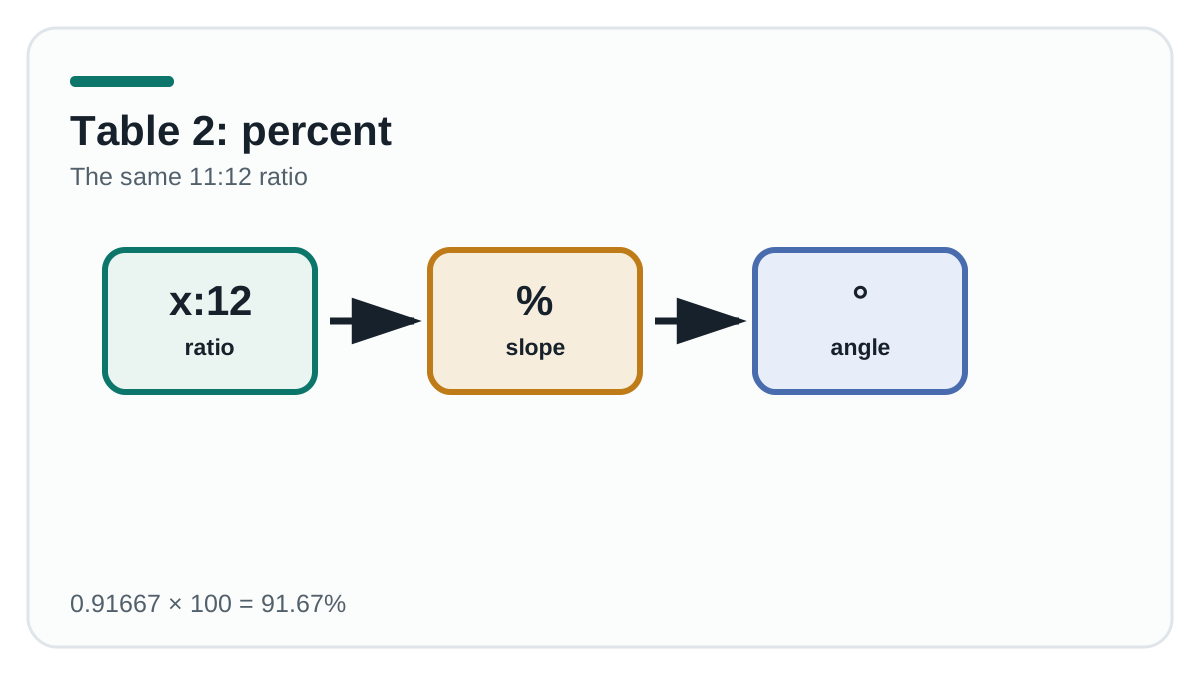
Table 2: the same ratio → slope percent
For a 12-inch run, multiply the decimal result in Table 1 by 100. This table does not introduce a second measurement; it simply changes the label on the same slope.
| Pitch | Rise ÷ 12 | Slope percent | Reverse check |
|---|---|---|---|
| 1:12 | 1 ÷ 12 | 8.33% | 8.33 ÷ 100 × 12 ≈ 1 in rise |
| 2:12 | 2 ÷ 12 | 16.67% | 16.67 ÷ 100 × 12 ≈ 2 in rise |
| 3:12 | 3 ÷ 12 | 25.00% | 25 ÷ 100 × 12 = 3 in rise |
| 4:12 | 4 ÷ 12 | 33.33% | 33.33 ÷ 100 × 12 ≈ 4 in rise |
| 5:12 | 5 ÷ 12 | 41.67% | 41.67 ÷ 100 × 12 ≈ 5 in rise |
| 6:12 | 6 ÷ 12 | 50.00% | 50 ÷ 100 × 12 = 6 in rise |
| 7:12 | 7 ÷ 12 | 58.33% | 58.33 ÷ 100 × 12 ≈ 7 in rise |
| 8:12 | 8 ÷ 12 | 66.67% | 66.67 ÷ 100 × 12 ≈ 8 in rise |
| 9:12 | 9 ÷ 12 | 75.00% | 75 ÷ 100 × 12 = 9 in rise |
| 10:12 | 10 ÷ 12 | 83.33% | 83.33 ÷ 100 × 12 ≈ 10 in rise |
| 11:12 | 11 ÷ 12 | 91.67% | 91.67 ÷ 100 × 12 ≈ 11 in rise |
| 12:12 | 12 ÷ 12 | 100.00% | 100 ÷ 100 × 12 = 12 in rise |
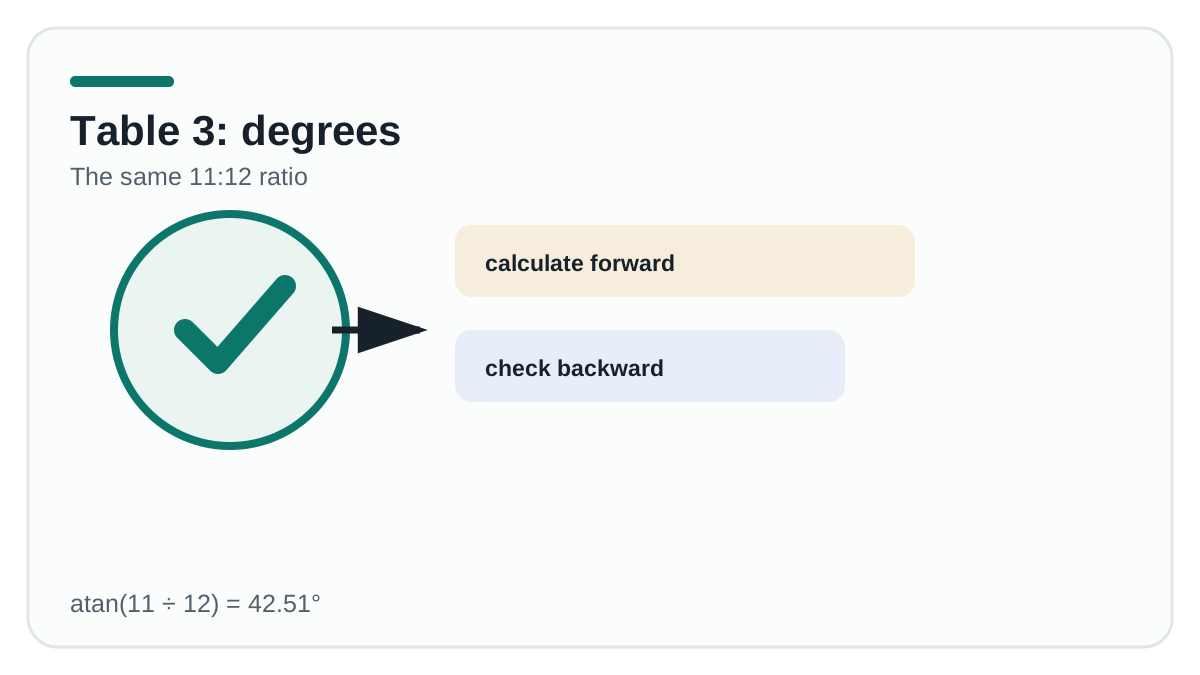
Table 3: the same ratio → degrees
Use angle = arctan(rise ÷ run). The angle is rounded to two decimal places; calculate from the displayed rise and run if a drawing calls for more precision.
| Pitch | Rise ÷ run | Angle | Reverse check |
|---|---|---|---|
| 1:12 | 1 ÷ 12 | 4.76° | 12 × tan(4.76°) ≈ 1 in rise |
| 2:12 | 2 ÷ 12 | 9.46° | 12 × tan(9.46°) ≈ 2 in rise |
| 3:12 | 3 ÷ 12 | 14.04° | 12 × tan(14.04°) ≈ 3 in rise |
| 4:12 | 4 ÷ 12 | 18.43° | 12 × tan(18.43°) ≈ 4 in rise |
| 5:12 | 5 ÷ 12 | 22.62° | 12 × tan(22.62°) ≈ 5 in rise |
| 6:12 | 6 ÷ 12 | 26.57° | 12 × tan(26.57°) ≈ 6 in rise |
| 7:12 | 7 ÷ 12 | 30.26° | 12 × tan(30.26°) ≈ 7 in rise |
| 8:12 | 8 ÷ 12 | 33.69° | 12 × tan(33.69°) ≈ 8 in rise |
| 9:12 | 9 ÷ 12 | 36.87° | 12 × tan(36.87°) ≈ 9 in rise |
| 10:12 | 10 ÷ 12 | 39.81° | 12 × tan(39.81°) ≈ 10 in rise |
| 11:12 | 11 ÷ 12 | 42.51° | 12 × tan(42.51°) ≈ 11 in rise |
| 12:12 | 12 ÷ 12 | 45.00° | 12 × tan(45°) = 12 in rise |
How to use the three tables as a cross-check
- Write down the physical rise and horizontal run you measured.
- Find that pair in Table 1 and retain the
x:12notation. - Use the same row in Table 2 or Table 3; do not substitute a new rise or a different run.
- Work backward once: percent × run ÷ 100 should recover the rise, and
tan(angle) × runshould recover it within the table’s rounding.
That backward step is the useful part of a chart. It exposes whether a ratio, percent, or degree was copied from the wrong row before it turns into a takeoff, cut layout, or conversation with a contractor.
Need a measurement walkthrough before using a chart? Follow the roof slope guide to collect matching rise and run.
What the chart does not decide
The tables convert roof geometry; they do not select a roof system, approve an assembly, or establish a framing cut. For product-specific slope questions, use the separate minimum slope for metal roof guide or minimum slope for asphalt shingles guide and verify the named product’s current instructions and project requirements.
Roof pitch chart FAQ
What is 6:12 as a percentage and degrees?
With a 12-inch horizontal run, 6:12 is 50.00% and 26.57°. Check both by starting with 6 ÷ 12 = 0.5.
Can I use a longer level than 12 inches?
Yes. Measure the rise over that level’s actual horizontal run, divide rise by run, and then multiply the result by 12 to express the pitch as x:12. Do not call the rise itself x:12 until you make that conversion.
Why does my degree value differ by a hundredth?
The chart rounds angles to two decimal places. Recalculate from your measured rise and run when a plan or tool requires a more precise value.
Method and source notes
- Geometry method:
ratio = rise ÷ run;percent = ratio × 100;degrees = arctan(ratio). Every table row is independently calculated from its printed rise and run. - Field-measurement context: reported level-and-tape measurement discussion (community discussion; accessed 2026-10-18). It illustrates a measurement workflow, not a construction standard.